I translate executive priorities into a governed portfolio and tie the work back to the P&L through rigorous budgeting and investment analysis — turning operational data into the business cases and KPI reporting leadership acts on.

I competed in collegiate tennis, where preparation, precision, and accountability matter every day. That background shaped how I work: own the point, adjust under pressure, and stay disciplined when the stakes are high.
Professionally, I bring that same mindset to portfolio budgeting, investment analysis, and KPI reporting. I like solving the messy middle — tying budgets, P&L data, and business cases back to numbers leaders can trust.
What matters most to me is ownership. I want to understand the numbers deeply enough to explain every variance, while staying close enough to leadership priorities to connect the analysis to business decisions.
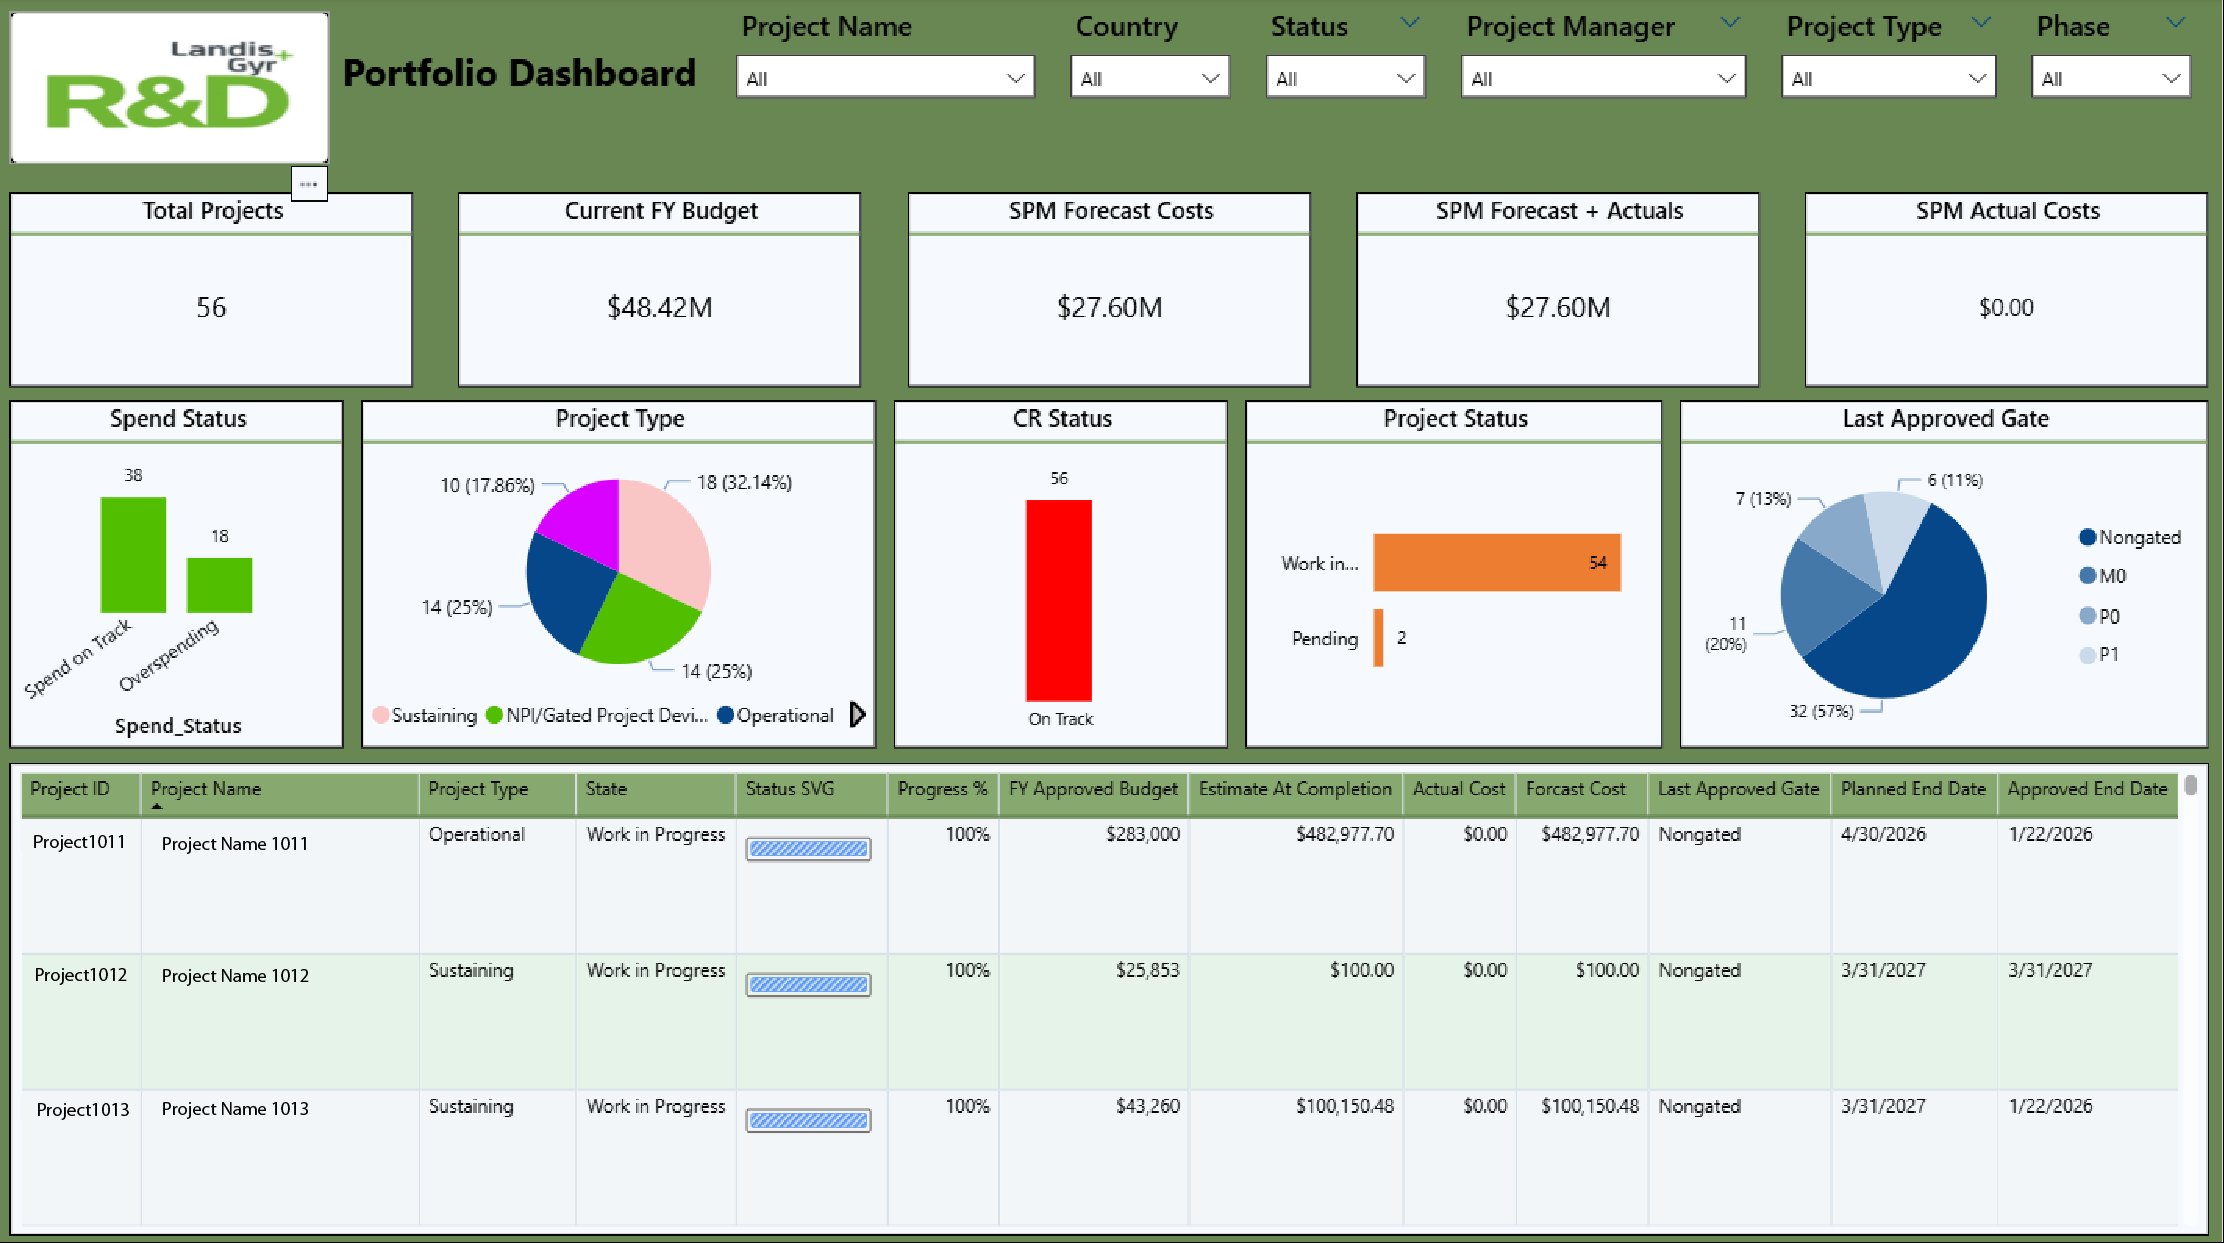
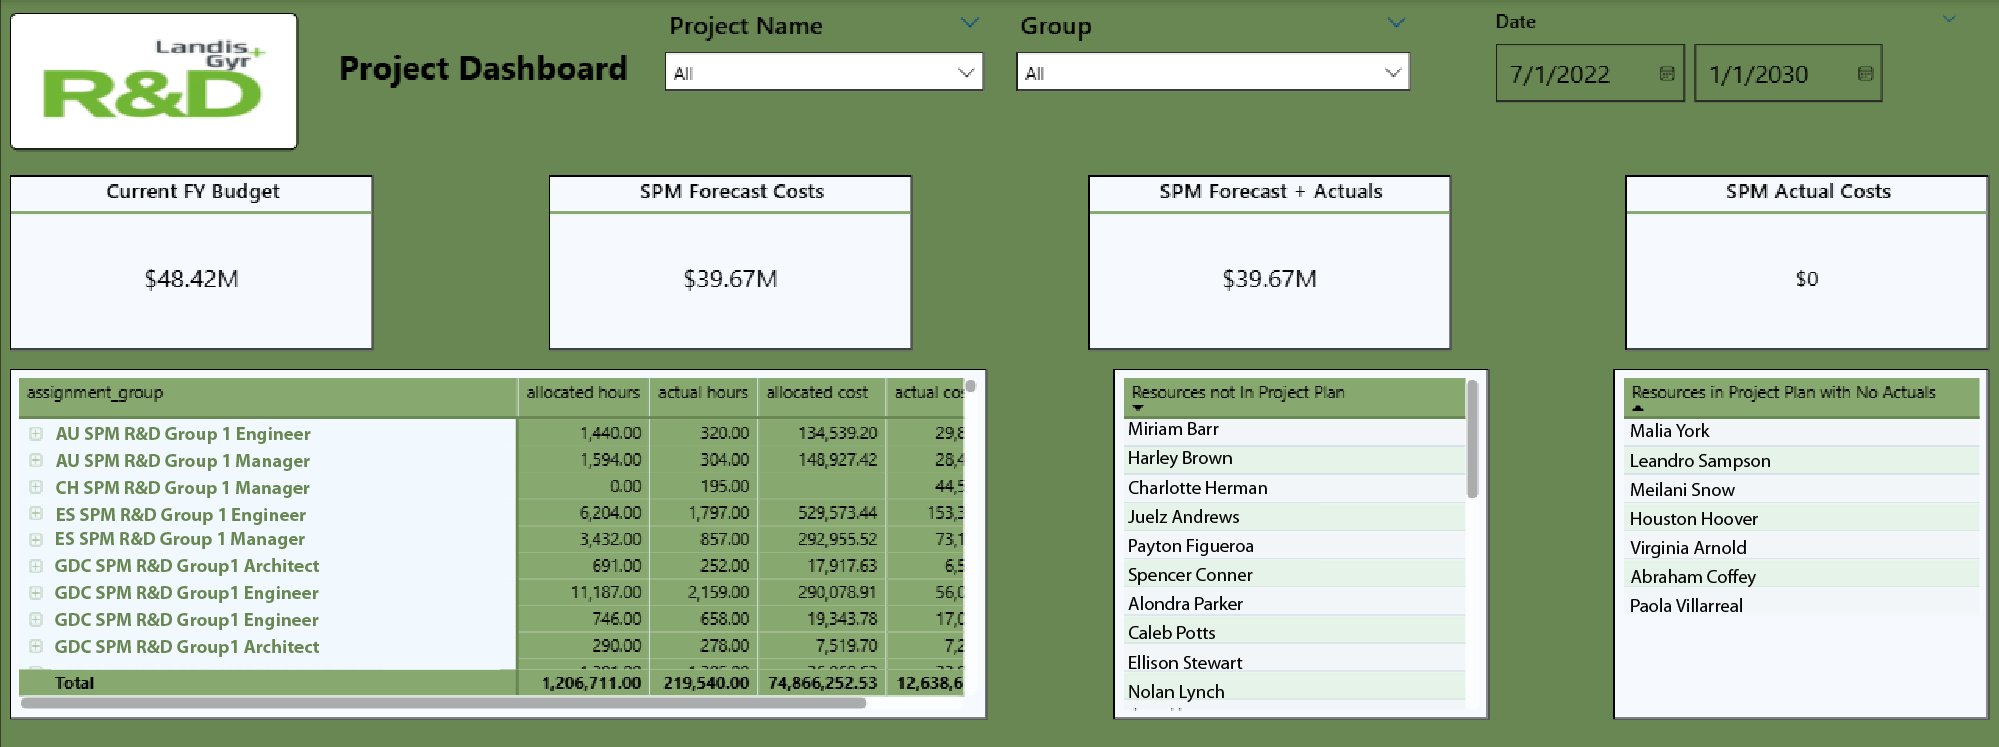
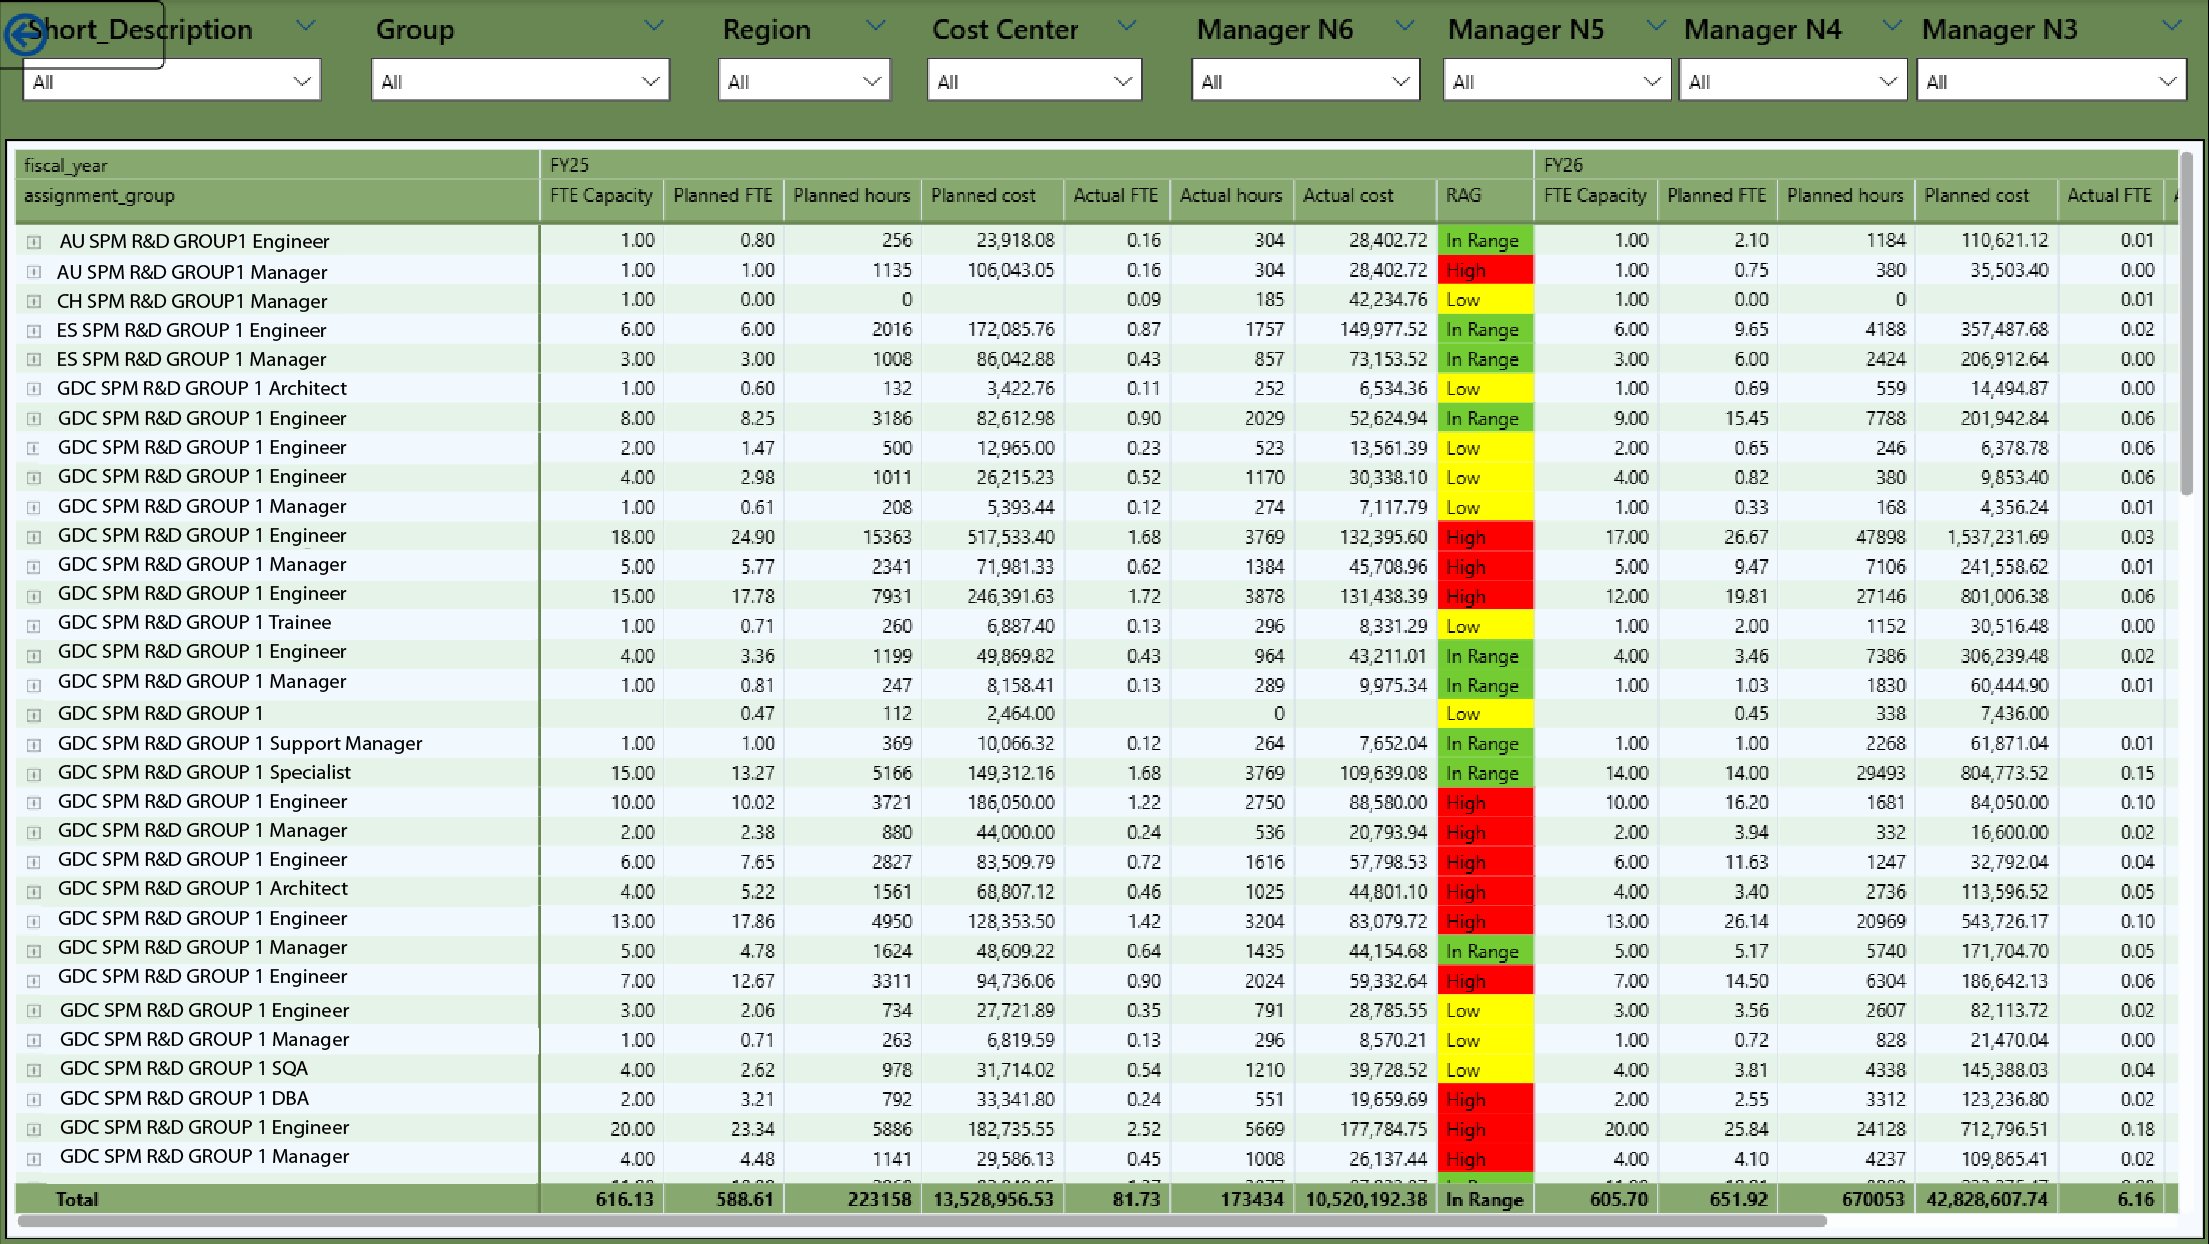
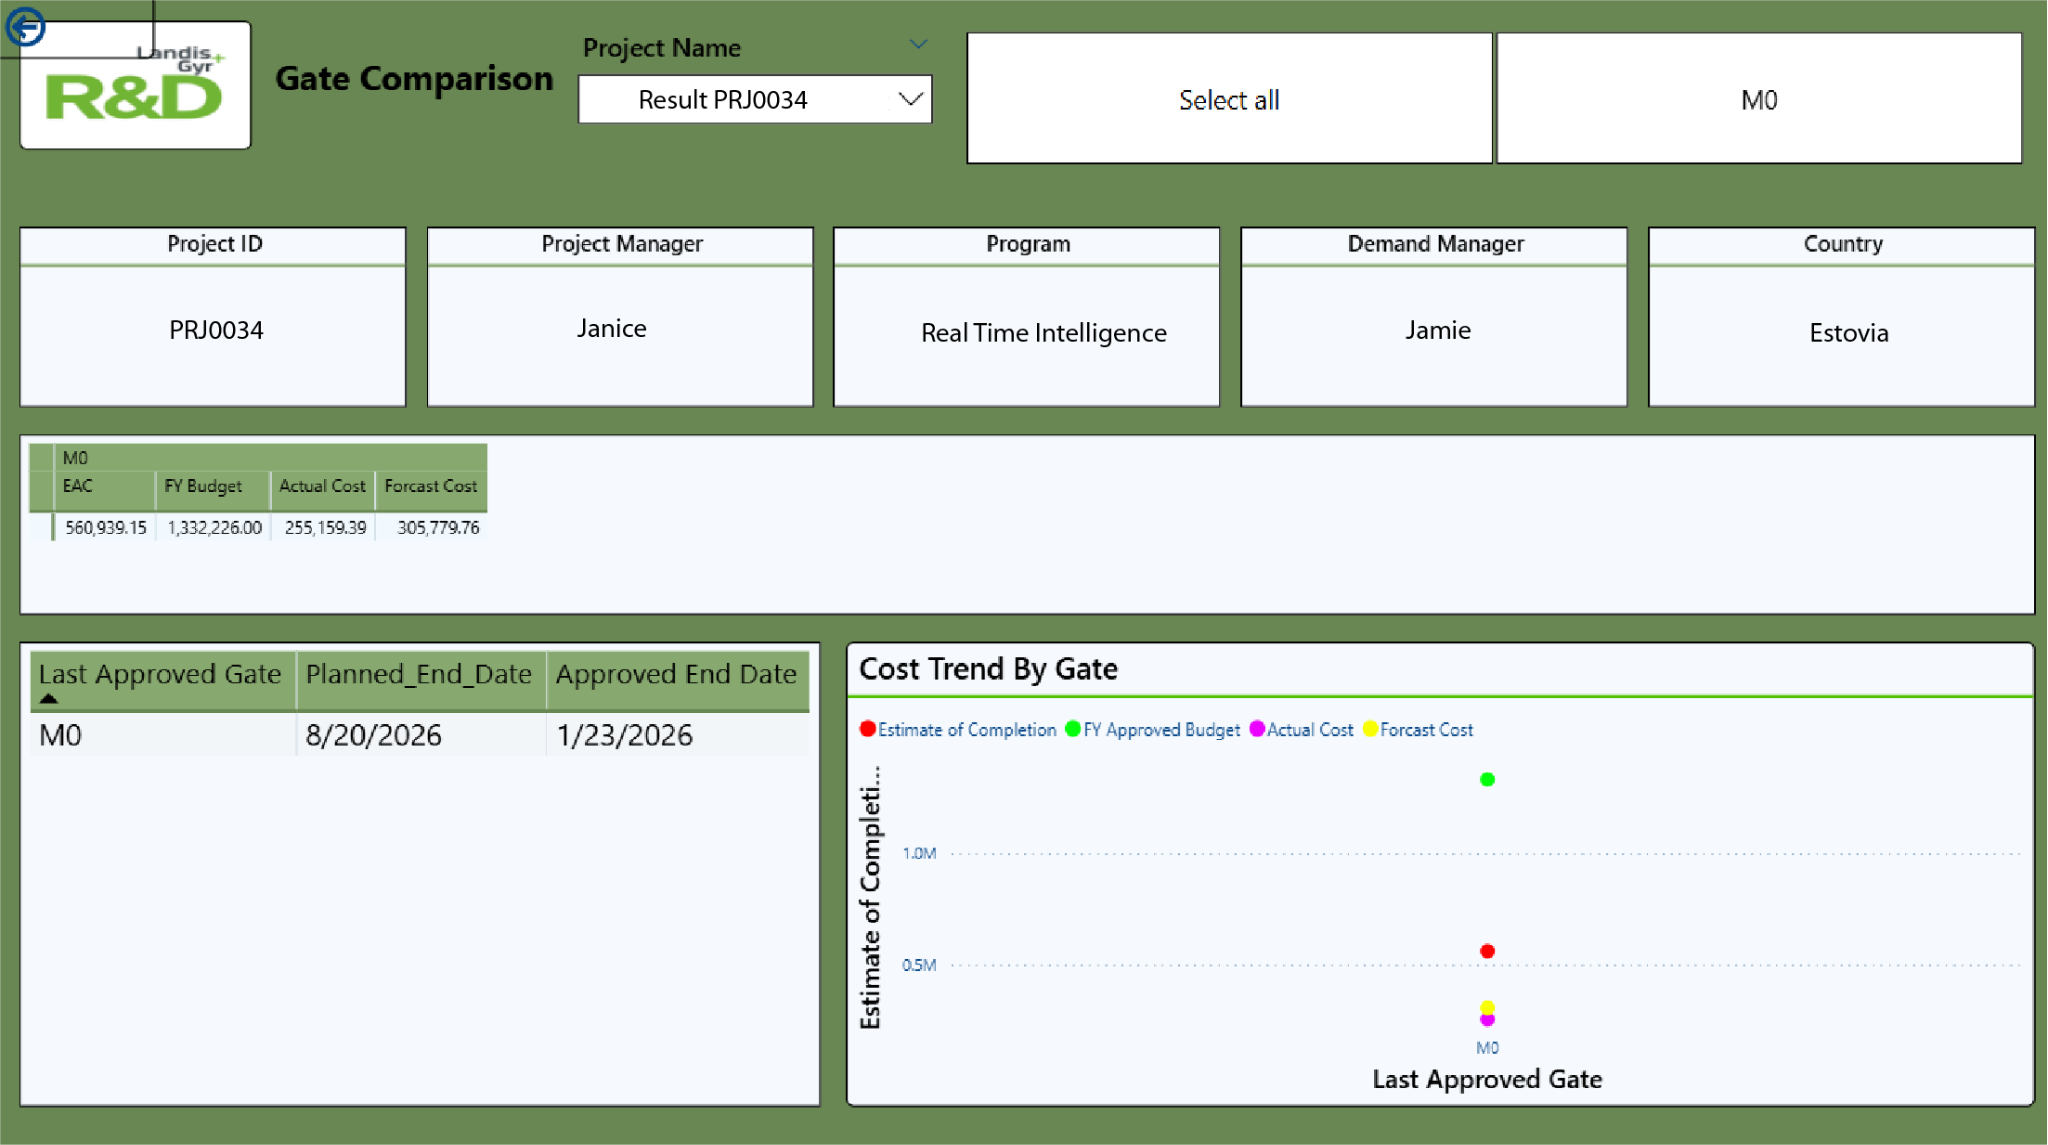
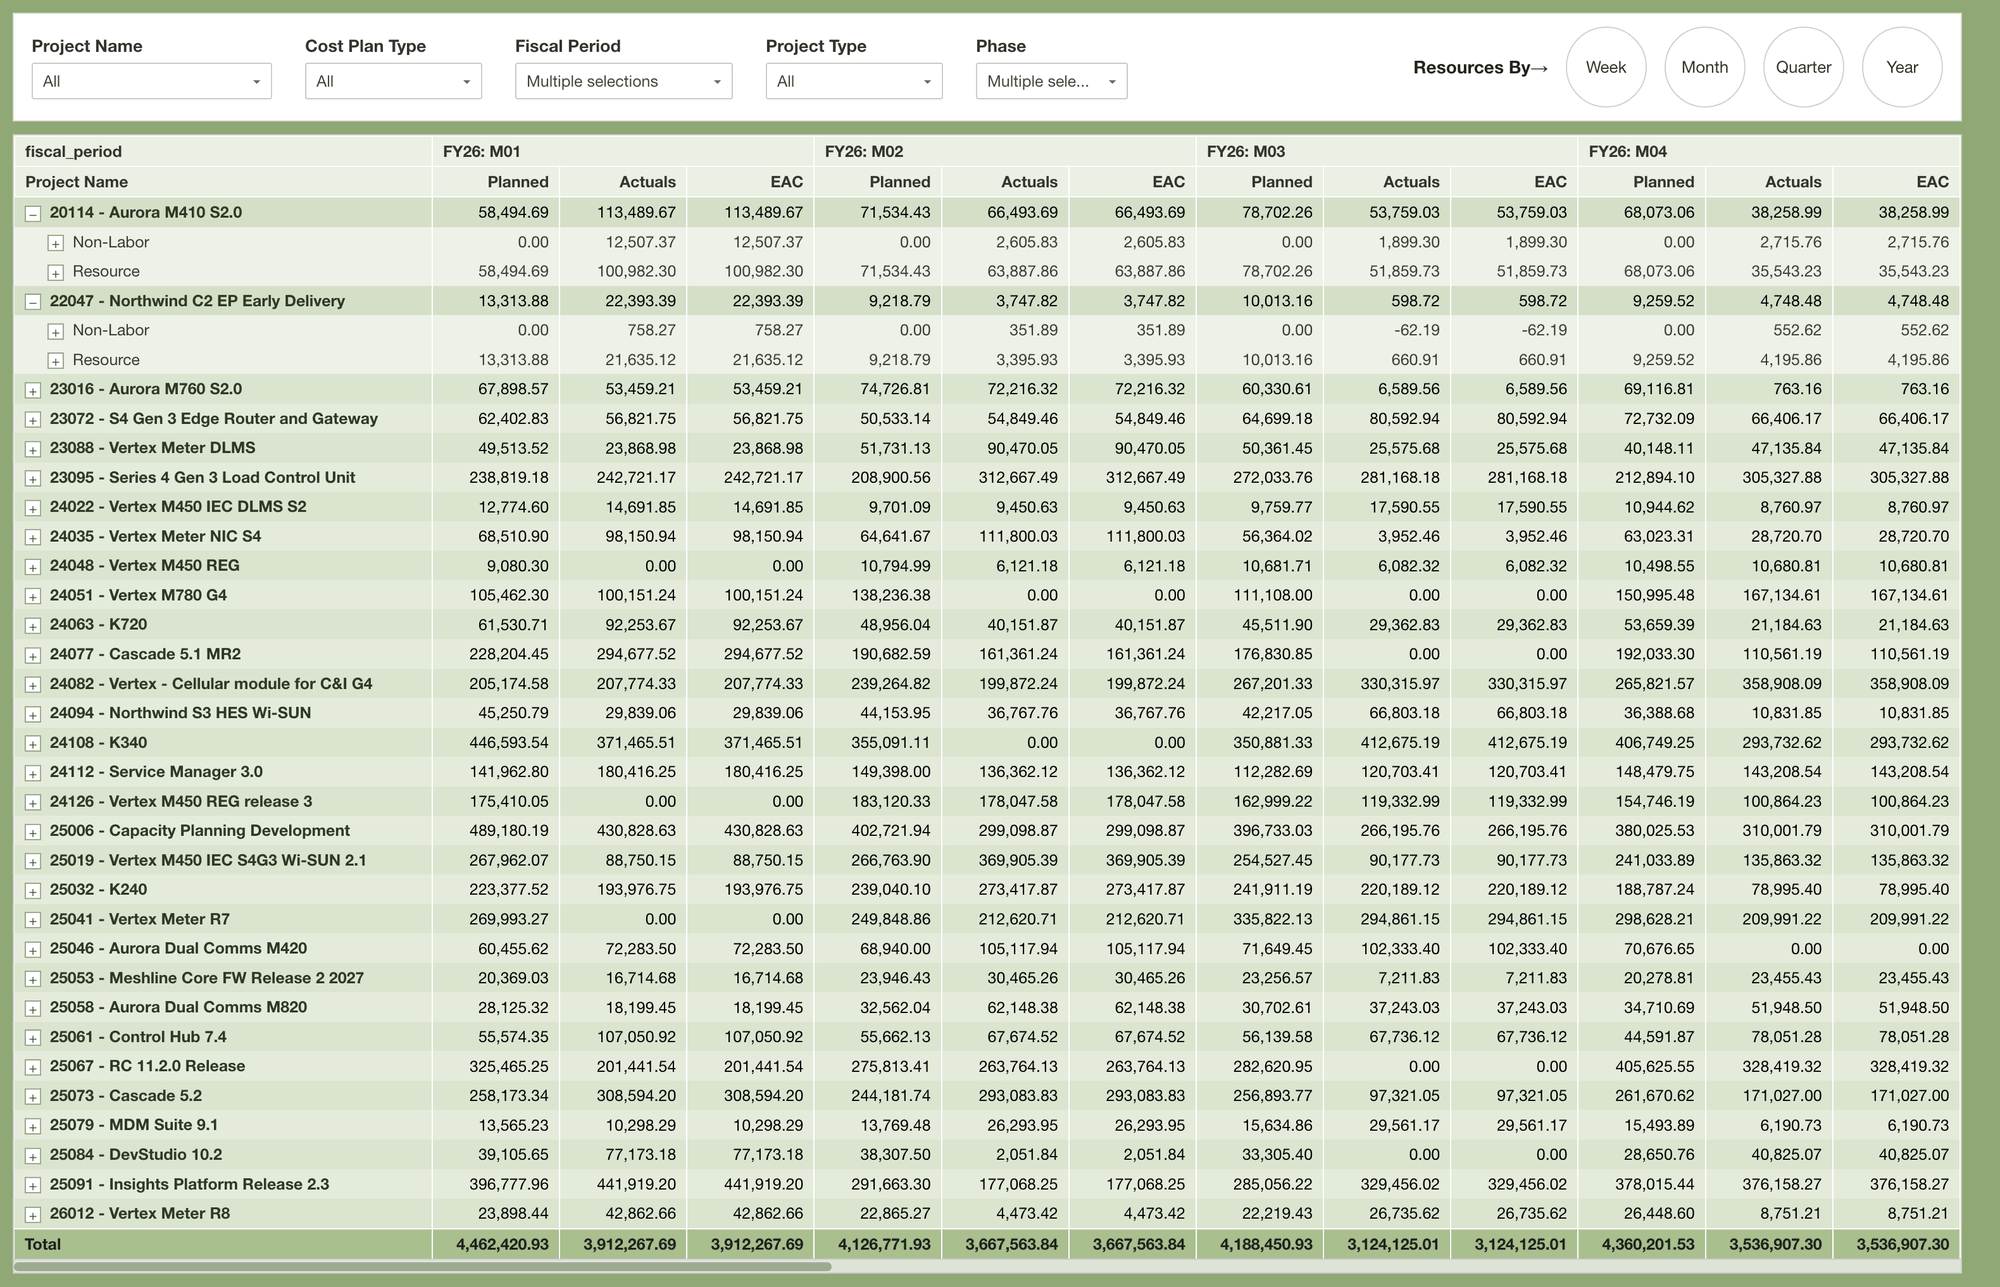
Real artifacts from real implementations. Click any diagram to expand.
Three implementations. The full story behind each one.
Landis+Gyr was paying $500,000 annually for Planview. Nobody was using it. The data that existed was unreliable, and the platform operated in complete isolation from the rest of the business. Leadership was making investment decisions without any real visibility into the portfolio.
I was part of the assessment team that evaluated the move to a new platform, and carried through as a core member of the full implementation team. The constraint was non-negotiable: the Planview renewal window was closing, which meant full migration and go-live had to happen within 5 months — or the organization would be locked into another expensive contract cycle.
Working as co-implementer alongside IT, I owned the labor cost and rate model architecture, business rules, approval workflow automation, Stage Gate lifecycle configuration, and reporting dashboards. I also designed and delivered the full change management and onboarding program from scratch — building every training session by role rather than by feature for 1,000+ users across the organization.
The platform was live and generating reliable data — but a large portion of the organization had no licenses, including finance and senior executives. They were still manually reconciling portfolio data from multiple sources, a process that took up to 2 days and carried consistent risk of error. Funding decisions were being made on information that was already outdated the moment it was compiled.
When leadership asked for better reporting access, I proposed something bigger: rebuilding the full enterprise data model in Microsoft Fabric rather than layering exports on top of flat files. The goal was a governed, always-current source of truth that anyone in the organization could access — no platform license required.
I architected the Lakehouse starting with a full API load to establish the baseline, followed by automated delta pulls that only retrieve updated fields on each run — preventing large repeated requests from impacting the source system. Once curated, the data became accessible org-wide. I then built 10+ Power BI dashboards connecting directly to the Lakehouse, with no manual refresh required.
The R&D portfolio used a single burden rate for everything: pricing projects during planning, and pricing those same projects again once hours were actually logged against them. That worked for planning, where an assumed rate is the only option before the work happens. But for actuals, it meant reported project cost was still just hours × an assumed rate — not a number tied to what the cost center actually spent. Every period, the actual cost rolling up from projects didn't reconcile to the cost center's real P&L spend, and there was no way to close that gap without constantly updating the rate itself, which broke every time there was a raise, RIF, or backfill.
Leadership needed project actuals that would reconcile to Finance's own P&L every period, not just approximate it. I already had what that required sitting in the data: what each cost center actually spent per period, and how many hours were submitted against projects from that cost center. The question was whether dividing those two real numbers — instead of applying the burden rate — would produce an actual cost that ties out by construction, every time.
I built an actual-cost allocation model that replaces the burden rate on the actuals side only: each period, divide the cost center's real P&L spend by the real project hours submitted against it, then allocate that number across every project in proportion to the hours it pulled from that cost center. Because both inputs come directly from the P&L and the submitted hours, the result reconciles to the cost center's real spend by definition — there's no assumption left to drift. I ran the calculation on a monthly cycle so a mid-year raise or RIF shows up immediately instead of smoothing across the year, and defined the hours denominator as project hours only — so the cost of PTO, training and admin time is absorbed into the rate charged to project work, which is what lets project cost alone tie to the P&L with no reconciling items. The burden rate still prices planning, where no actual spend exists yet to divide — but actuals now run entirely on this method.
Two implementations. One before. One after. Here’s what actually changed.
| Before - Planview Era | After - ServiceNow SPM + Fabric | |
|---|---|---|
| Platform Cost | $500K per year with minimal return on investment | $250K saved annually from day one of go-live |
| User Adoption | Low adoption — most users had stopped logging in entirely | 95% timecard adoption across 1,000+ R&D users |
| Financial Reporting | Manual reconciliation across multiple sources, taking up to 2 days per cycle | Instant. Automated pipelines deliver always-current data |
| Data Access | Siloed inside the platform — only licensed users could see anything | 800+ stakeholders with real-time access via Fabric Lakehouse |
| Portfolio Visibility | No reliable source of truth, data integrity constantly questioned | Single governed source tied directly back to the P&L |
| Resource Planning | No visibility into utilization, overallocation, or capacity gaps | Real-time capacity planning surfaced automatically |
| Executive Decisions | Funding decisions made on stale, manually compiled information | Live portfolio intelligence driving every executive review cycle |
The case studies above describe work done inside a company. These are the methods rebuilt from scratch on public, synthetic data — so the reasoning, the code and the numbers can be inspected directly.
The method behind Case Study 03, built end to end: two ways to price project actuals side by side, and why only one of them ties to the P&L. The reconciliation is asserted in a test suite rather than eyeballed.
The governance model behind Case Studies 01 and 02: a stage-gate lifecycle with a matrix-driven approval chain, snapshot-based change control on project financials, and an M0 intake gate that converts an approved demand into a project.
Bank sync into Postgres, a transaction categorization engine, and a Streamlit planner with cross-filtering KPIs and a debt-payoff simulator with adjustable income and spending levers.
FastAPI ingestion from Apple Health, a LightGBM model for race-time prediction, and Banister CTL/ATL/TSB training-load tracking — with an honest goal-feasibility projection rather than an optimistic one.
Looking for full-time roles in financial & business analysis, budgeting & investment analysis, and KPI/executive reporting — at companies that need someone who can turn financial and operational data into the analysis, dashboards, and business cases leadership acts on.
The best way to reach me is through LinkedIn. Connect with me there, send a message, or check out my full profile to learn more about my background and experience.
Connect on LinkedIn